NDP is net domestic product, which is calculated as the difference between GDP and depreciation.
Indirect taxes are included in the price of goods and services and are actually government revenues that it receives without using economic resources in the production process. Thus, indirect taxes raise prices by raising costs, but do not create any economic benefits. NI is equal to the sum of the primary incomes of the owners of factors of production. The structure of ND is the most important indicator of the distribution of incomes of various segments of the population.
Main components of national income:
1. remuneration for work (70-80%, officially 45% in the Russian Federation);
2. income of small producers (unincorporated sector) - these incomes are mixed - they cannot be divided into profits as owners and wages as employees of own firms (several percent);
3. income from property (interest, profit of joint stock company, rent) - 15-20%.
As a rule, personal income is larger than the national income through transfer payments.
Transfer payments are allowances and subsidies received by the population from the state. These are unemployment benefits, disability benefits, free and reduced medicines, payment subsidies utilities, maternal capital, pensions, scholarships, etc.
disposable personal income This is income that the population can dispose of at its discretion. This is personal income minus individual taxes.
This indicator is important for analyzing the standard of living in the country, analyzing the structure of purchasing opportunities for various segments of the population, and studying the effectiveness state regulation in the social sphere.
Price indices. GDP deflator
The change in the price level has a significant impact on the GDP indicator. Distinguish between nominal and real GDP.
Nominal GDP reflects the physical volume of goods and services produced in current prices in force in a given year.
Real GDP is nominal GDP adjusted for price changes or expressed in base year prices. The base year is the year from which the measurement begins or against which the GDP is compared.
To bring nominal GDP to its real value, two indices are used: index consumer prices(CPI) and GDP deflator.
To determine the CPI, the concept of "consumer basket" is used, which includes about 300 items of the most widely used goods.
The difference between the CPI and the GDP deflator is as follows:
The GDP deflator is calculated for a changing set of goods and is Paasche index, and the CPI is calculated for a constant set of goods and is called Laspeyres index;
The GDP deflator shows price changes for the entire list of products and services produced in the economy, while the CPI shows price increases only for consumer goods;
The GDP deflator takes into account the change in the structure of goods produced, while the CPI does not;
The GDP deflator shows the change in prices for products produced by national factors, while the CPI takes into account the change in prices for imported goods.
Two factors influence the level of nominal GDP: real growth production volumes of goods and services and price fluctuations. The GDP deflator makes it possible to obtain the value of GDP without taking into account changes in prices for goods and services produced:
The change in the GDP deflator reflects the change in the general price level, i.e. the process of inflation or deflation.
Adjusting nominal GDP using the CPI or the GDP deflator makes it possible to make this most important indicator comparable over the years.
4. Economic growth: essence, types, indicators, factors
The economic growth is such a development national economy which increases real GDP. This is not a short-term, but a long-term increase and qualitative improvement of GDP and its factors of production.
Essence and meaning economic growth is to permanently resolve the main economic problem- contradictions between limitations economic resources and limitless human needs. Economic growth allows you to simultaneously increase available resources, increase current consumption, as well as additional investments in the development of production.
Economic growth is the most important indicator of development National economy.
Economic growth indicators:
· An indicator of the growth rate of real GDP;
· An indicator of the growth rate of real GDP per capita.
| GDP growth rate = (GDPt – GDPt-1): GDPt-1 | (23) |
where GDPt is the GDP of the current year;
GDPt-1 - GDP of the previous year.
Factors of economic growth:
Increasing the number and improving the quality labor resources;
Growth in the volume and improvement of the qualitative composition of fixed capital;
· improvement of technology and organization of production;
Increasing the quantity and quality of used natural resources;
the growth of entrepreneurial abilities in society.
Types of economic growth:
· Extensive economic growth involves an increase in output through the use of additional resources (means of production, labor, additional financial resources).
· Intensive economic growth is associated with an increase in production efficiency and involves an increase in output per unit of resources used.
Intensive economic growth is manifested by:
· in the use of the achievements of the GDP, the renewal of production;
in the improvement of the qualifications of employees;
In improving the quality of products, updating the range.
If the share of real GDP obtained as a result of intensive growth factors exceeds 50%, then the economy as a whole is characterized by a predominantly intensive type of ER; if less than 50% - predominantly extensive type of economic growth.
Minimum requirements for economic growth - the rate of economic growth must exceed the rate of population growth.
Questions for self-control
1. Define GDP and GNP. Why is GDP (GNP) the main macroeconomic indicator?
2. What is the difference between nominal and real GDP?
3. Why is the GDP price index called a deflator and not a GDP inflator?
4. What is the relationship between GDP (GNP) and other macroeconomic indicators?
5. What are the main types of economic growth?
6. List the main factors influencing economic growth.
THEME 10. Macroeconomic instability: unemployment, inflation, crises
1. Unemployment and its forms
2. Inflation and its types
3. Business cycles
Unemployment and its forms
The International Labor Organization (ILO) defines an unemployed person as a person who did not have a job in the period under review, was actively looking for it and is ready to start working on it.
In accordance with Russian legislation The unemployed are able-bodied citizens who do not have a job and earnings, are registered with the employment service in order to find a suitable job and are ready to start it.
The labor force is represented by two groups of the population: employed, i.e. participate in the creation of wealth, and the unemployed.
The labor force is commonly referred to as the economically active population.
Depending on the duration of the unemployment period, frictional, structural and cyclical unemployment are distinguished.
frictional unemployment reflects the turnover of personnel associated with a change of place of work, residence, education, with the transition from a low-paid to a higher-paid one. It is voluntary and limited short terms. In developed countries, as a rule, it is 2-3% of EAN.
Structural unemployment arises from a discrepancy between the structure of demand and supply of labor. Structural unemployed people cannot immediately get a job without retraining or changing their place of residence. Therefore, structural unemployment is predominantly involuntary and long-term.
Structural unemployment is associated with technological shifts in the economy, as a result of which there is a depreciation of the skill level of certain categories of the labor force, with the scientific and technological revolution, as a result of which the industry structure National economy. To reduce structural unemployment, it is necessary to expand the system of training and retraining of personnel, improve the skills of workers, and effectively interact with employment services and enterprises.
Unemployment rate at full time, equal to the sum of frictional and structural unemployment, is called the natural rate of unemployment. The real GDP that is created at the natural rate of unemployment is called potential GDP or the productive potential of the economy. The natural rate of unemployment is the social minimum level, which corresponds to the concept of full employment.
Cyclical unemployment arises due to a decline in production during economic crises when the supply of labor exceeds the demand for it. During recessions, there is a reduction in aggregate demand, which causes a reduction in production. The result is a decline in employment.
Cyclical unemployment reaches a minimum with an increase and a maximum with a decline in production and can range from 0 to 10% or more. During the Great Depression 1929-1933. The unemployment rate in the United States has reached its highest level - 25%. To combat cyclical unemployment, it is necessary to develop state special government programs providing employment (programs of public works).
Rice. 17. Unemployment in Russia
Unemployment indicates the underutilization of labor resources and, in general, the underutilization of production opportunities. As a result, the country is experiencing a decrease in economic growth, a lag in the volume of GDP growth.
The American economist Arthur Oken mathematically expressed the relationship between the unemployment rate and the size of the gap in GDP. AT economic theory This causal relationship is called Okun's law according to which the excess of the actual unemployment rate by 1% over the EUB leads to a lag in real GDP by 2.5% from its potential level.
Thus, it is possible to determine the economic losses of society from unemployment.
Inflation and its types
The term "inflation" was first used in North America during the Civil War of 1861-1865. to denote the process of swelling of paper money circulation. Inflatio in Latin means "swelling". The essence of inflation was reduced to an excessive increase in the number of paper money in circulation compared to the supply of goods.
Depending on what forms the inflationary disequilibrium of markets takes, there are open and depressed(hidden) inflation. Open inflation manifests itself in a prolonged rise in the price level, while hidden inflation manifests itself in an increase in the shortage of goods and services. In a market economy, inflation is open (price) in nature, in a command-administrative economy it is suppressed. Until 1992, inflation in Russia was subdued.
Depending on the rate of growth, open inflation can proceed at different rates. In this regard, economists distinguish:
creeping inflation, when prices rise by 3-4% per year;
galloping, when inflationary tendencies take on a rapid character and the annual price increase is tens and hundreds of percent;
· hyperinflation - prices grow at an astronomical rate, reaching many thousands of percent per year.
Depending on the causes of inflation, economists distinguish between supply and demand inflation. Demand inflation generated by an excess of aggregate demand over real output. Buyers are directly involved in its formation.
The second form of open inflation is the increase in costs, which also leads to an increase in the price level. This process has been named supply (cost) inflation. Cost-driven inflation theory explains price increases as a double monopoly . In the market, on the one hand, oligopolistic firms collide, and on the other, oligopolistic trade unions. Inflation can be initiated by either one side or the other, fighting to increase their share of the national income. Under the pressure of the trade unions, wages rise, which, however, does not reflect the growth of labor productivity, therefore, in order not to reduce profits, entrepreneurs are forced to increase prices. Entrepreneurs can also make a preemptive strike: price costs plus a certain percentage to compensate for the expected inflation.
Cost inflation can be formed on the basis of rising prices for raw materials and energy. Raw materials become more expensive, as the conditions for extraction and transportation change, prices for imported equipment etc.
Inflation is measured using a price index, which is equal to the ratio between the price of a certain set of goods (basket) in the current year and the price of a similar basket in base period(in percents). The price index determines their general level in relation to the base period.
In addition to the price index, the inflation rate is often used:
2. Inflation rate = (price index of last year - price index of current year): price index of current year) × 100%
Inflation can be measured using the "rule of seventy". This rule is usually applied when it is necessary to establish how long it will take for the price level to double. To do this, you need to divide the number 70 by the annual inflation rate.
3. Number of years needed for prices to double = 70: annual inflation rate (%).
Rice. 18. Inflation in Russia (%)
English economist A.U. Phillips was the first to attempt to theoretically substantiate the relationship between inflation and unemployment. In 1958, he found an empirical relationship between the annual percentage change in nominal wages and the share of the unemployed in the total labor force in England during 1861-1913. This relationship was illustrated by Phillips as a curve with a negative slope, which indicated an inverse relationship between the variables under consideration. Subsequently, the curve received the name of its author.
Rice. 19. Phillips Curve
Subsequently, other economists in the 50s and 60s of the twentieth century. based on the analysis of later statistical data, confirmed the conclusions of their A.U. Phillips. According to the Phillips curve, in the period under study, wages grew slowly at high level unemployment and faster - with higher employment. Price stability and low unemployment turned out to be incompatible goals: reducing unemployment was achieved at the cost of accelerating inflation, and reducing inflation led to an increase in the number of unemployed.
Business cycles
Economic (business) cycle - regular fluctuations in the levels of production, employment and income with a frequency of 2-3 years, 10-12 years. Significant expansion or contraction occurs during the cycle business activity in most sectors of the economy. The most striking manifestations of instability are inflation and unemployment.
The cycle can be divided into two periods: descending (fall in production) and ascending (growth in production). Peaks and troughs characterize the turning points of cycles.
Fig.20. Phases business cycle
Phases of economic cycles:
· the peak is accompanied by the active commissioning of new enterprises and the modernization of old ones, the growth of production volumes, employment, investment, personal income, an increase in demand and prices, and ends with a boom - a period of super-high employment and overload of production capacities. During a boom, the price level, the wage rate and the interest rate are very high. At the highest point of the cycle, called the peak, all indicators reach their maximum value.
Growth in production is replaced by recession. This indicates the onset of a crisis phase. The volume of production, investments are decreasing, unemployment is growing. There is a sharp decrease in profits, the demand for credit is weakening, and interest rates are falling.
in phase depression the decline in GDP and the increase in unemployment are significantly slowing down, the volume of investment is close to zero.
After a certain time, the economic system overcomes the lowest point of the cycle, called the trough, and begins revival. Income and employment are starting to rise again. When enterprises bring the volume of production to the highest point reached in the previous cycle, then the economic climb.
The reasons for fluctuations in business activity are different:
the life of the fixed capital production stocks(3-4 years); machines and equipment (8-10 years); buildings and structures (20-25 years).
unevenness scientific and technological revolution. Such fluctuations are known as the 50-year Kondratieff cycles;
Volume fluctuations money supply and etc.
Questions for self-control
1. What are the main forms of unemployment.
2. What is the natural rate of unemployment?
3. What are the causes of cyclical unemployment?
4. Name the main types of inflation.
5. Define the economic cycle and name its main phases.
6. What are the main reasons for the cyclical development of the economy?
TOPIC 11. Macroeconomic equilibrium:
1. Model "aggregate demand and aggregate supply
2. Consumption and savings
3. Investment
4. The income-expenditure model in Keynesian theory
1. Model "aggregate demand and aggregate supply"
Aggregate demand (AD) is the real GDP that consumers are willing to purchase at every given level prices. The AD curve shows the quantity of goods and services that buyers are willing to purchase at possible price levels. It shows an inverse relationship between the price level and real GDP.
· The effect of import purchases - an increase in the price level for domestic goods compared to prices abroad leads to an increase in demand for imported goods and a reduction in exports, i.e. to a decrease in net exports. And vice versa.
Non-price factors of aggregate demand:
· Changes in consumer spending;
· Changes in investment costs related to interest rates, business taxes, technology.
Changes public spending
· Changes in net export costs associated with the national income of foreign countries, major events in world politics, fluctuations in exchange rates.
Rice. 22. Change in aggregate demand
The increase in aggregate demand is graphically illustrated by an upward shift in the AD curve as a result of an increase in consumer spending, investment spending, government purchases of goods and services, and spending on net exports. A decrease in aggregate demand graphically means a shift of the AD curve to the left and down, if these determinants tend to decrease.
Aggregate supply is the real output offered by producers within the national economy at each possible price level.
The aggregate supply curve reflects a direct relationship between the level and the level of real output. The AS curve consists of three segments: horizontal (Keynesian), intermediate (ascending) and vertical (classical).
The Keynesian period is characterized by underemployment. The economy is characterized by significant unemployment and underutilization of production capacities. The growth of national output is not accompanied by an increase in the price level.
The intermediate segment of the aggregate supply curve corresponds to the real volumes of national production close to full employment. An increase in output is accompanied by an increase in the price level.
The classical (vertical) segment of the AS curve characterizes the economy of full employment. Firms can increase their own production only through the reallocation of economic resources by offering, for example, higher wages. In general, the national output will remain unchanged. Thus, on the classical segment of the aggregate supply curve, only the price level can change.
Rice. 23. Aggregate supply curve
In addition to the general price level, the aggregate supply is influenced by numerous non-price factors (determinants):
prices for the main economic resources;
Resource productivity
applied technologies;
· the level of taxation and the degree of state regulation of the economy.
Rice. 24. Change in aggregate supply
An increase in aggregate supply is graphically illustrated by a shift in the AS curve to the right and down as a result of an increase in the productivity of resources, a decrease in their prices, the introduction of high technology, reducing the tax burden on manufacturers and other non-price factors.
A decrease in aggregate supply graphically means a shift of the AS curve to the left and up with the opposite action of these determinants.
Graphically, macroeconomic equilibrium means the intersection of the AD and AS curves at a point, the parameters of which are the parameters of macroeconomic equilibrium (the equilibrium price level and the equilibrium volume of production).
Macroeconomic equilibrium on the horizontal (Keynesian) segment of the aggregate supply curve characterizes an economy in a state of economic recession, when the dynamics of prices for goods and services produced have no effect on real output. Deviation from equilibrium is manifested in a change in the real volume of GDP at a relatively constant price level.
Rice. 25. Macroeconomic equilibrium in the AD-AS model
Equilibrium in the national market, corresponding to an intermediate segment of the aggregate supply curve, characterizes an economy close to full employment, when an increase in output becomes possible only as a result of an increase in the price level, and a decrease in output as a result of a decrease in the price level.
Macroeconomic equilibrium on the vertical (classical) segment of the aggregate supply curve characterizes the economy of full employment and corresponds to the potential volume of production, when only the price level can change.
Consumption and savings
Consumer spending is the most significant component of aggregate demand. Consumption typically accounts for more than half of total demand.
Consumer behavior depends on many factors, the main of which is income. Consumption is the portion of income that is used to purchase goods and services. The structure of consumption is individual, but there are general priorities that are associated with the cost of food, clothing, housing, medicines, transportation services, etc. As family income grows, spending on durable goods, recreation, etc. increases.
The size and dynamics of consumption and savings in economics analyzed using consumption functions and savings functions.
The graph of consumption (propensity to consume) shows a direct relationship between consumption (C) and disposable income (DI). Each point on the bisector characterizes the amount of possible income that is fully consumed.
The consumption curve is a straight line that crosses the bisector. The intersection point characterizes the amount of threshold income that is fully spent. At incomes below the threshold, consumer spending exceeds available income (“living in debt”). When income is above the threshold, it becomes possible to make savings.
There are two main uses for disposable income: consumption and savings. Savings can be defined as the non-consumable part of income, as deferred consumption, future consumption. Thus, saving is the portion of disposable income that is not consumed.
Rice. 26. Graphs of propensity to consume and save
The savings schedule (S) is derived from the consumption schedule. The point of intersection of the savings graph with the "income" axis corresponds to zero savings. The points on the savings graph to the left of the zero savings point mean negative savings (living in debt). The dots on the left represent positive savings.
Average propensity to consume( average propensity to consume - APC) is the part of disposable income that goes to consumption. APC is determined by the formula:
With a change in the amount of disposable income, the ratio between consumer spending and savings obviously changes, i.e. change in the propensity to consume and save.
marginal propensity to consume( marginal to consume - MPC) – shows the share of the increase in income used for consumption.
marginal propensity to save( marginal to save - MPS) - shows the share of income growth used for savings.
Investments
In a broad sense, investments are monetary investments in any assets for the purpose of generating income. Distinguish:
· real investment(capital investments) are investments in tangible assets (land, equipment, structures, inventories, housing construction etc.));
Financial investments are investments in securities (for example, in the purchase of shares, bonds, etc.). AT given value investments are used in the theory of finance.
In economic theory, the term "investment" refers to real investment. Unlike consumer spending, which is stable, investment spending is volatile and dynamic. During periods of economic crises, first of all, investments in the purchase of equipment, inventories, production and housing construction are significantly reduced.
The main factors affecting the level of investment are:
the expected rate net profit(profitability);
· interest rate.
Interest rate is the price paid for the use of money. In the case under consideration money capital required to purchase real capital as an economic resource.
For making investment decisions, the determining role is played by the real, not the nominal interest rate. The real interest rate is measured in constant prices, i.e. in inflation-adjusted prices. The nominal interest rate is measured in current prices.
An investment is profitable if the expected rate of net return exceeds the real interest rate. And vice versa.
The level of the interest rate is of fundamental importance even in the case of investing with own funds(reinvestment of profits). In this case, the firm incurs an opportunity cost equal to the interest rate, which is the income that the firm gives up in order to make an investment.
Investment demand reflects the dependence of the volume of investments on the level of the real interest rate, which the investor compares with the expected rate of net profit. The investment demand curve shows an inverse relationship between the interest rate and the amount of investment. Factors affecting the level of investment:
business taxes;
changes in technology;
expected profits of firms;
purchase costs, Maintenance and exploitation of investment goods.
4. The income-expenditure model in Keynesian theory
In accordance with the Keynesian direction in economic theory, it proceeds from the fact that the motor economic development is the aggregate demand. It is he who determines the aggregate supply. It is derived from aggregate demand and focuses on the expected aggregate demand.
The graph illustrating the equilibrium of an economic system as the point of intersection of planned total expenditure and income (GDP) is called the "Keynesian cross". "Keynesian cross" is an interpretation of the model of aggregate demand - aggregate supply under conditions of rigid pricing.
The classical understanding of the economy is based on the assertion that flexible pricing dominates and the price level can take on any value. The Keynesian model describes the economy in the short run, which is characterized by rigid prices.
Price rigidity in an economy means that supply and demand are balanced not by changes in the price level, but by the fact that sales volumes and changes in inventories give firms information about what and how much buyers want to have. The AD-AS model, therefore, can only indicate the equilibrium output, but cannot show how this equilibrium is reached.
Therefore, to describe the equilibrium in an economy with rigid prices, it is necessary to construct a graph that reflects the dependence of supply and demand on the volume of national income. In Fig. 27, the horizontal axis reflects national income Y, coinciding in magnitude with the volume of national output, and along the vertical - the volume of aggregate demand.
Since aggregate demand equals the sum of demand for consumer goods and investment goods, it can be represented graphically by summing the consumption and investment curves at each level of income.
The Keynesian cross shows how planned total spending (consumer spending, investment spending, state procurements and net exports affect output). The economic system is in equilibrium only when planned total expenditure equals income (GNP).
Thus, the analysis of the "Keynesian cross" shows that the general equilibrium in the economy, established in the described way, does not necessarily correspond to a level of national income that allows for full employment. The equilibrium volume of national income in the Keynesian model is determined by the propensity of people to consume, save and invest. With a low propensity to consume and invest, the equilibrium output may be lower than potential (achieved with full use of resources).
Great Depression 1929-1933 was a convincing evidence of the correctness of the theoretical conclusions of J. Keynes. All hopes for the ability market economy cope with the global crisis that hit all highly developed countries, proved to be futile. The economy continued to function at a low level of employment, showing no signs of recovery. According to J. Keynes, only the state could lead it out of protracted stagnation. Only an increase in government spending (G) can compensate for the shortfall in aggregate demand resulting from low consumer spending and the lack of incentives for private firms to invest, and thus bring about an economic equilibrium at full employment of resources. Y3 is the total income corresponding to the national output at full employment of resources.
Rice. 27. Income-expenditure model (Keynesian cross)
Any change in the costs that make up aggregate demand (consumer, investment, government) sets in motion a multiplier effect, which is expressed in the excess of the increment in aggregate income compared to the change in aggregate demand. At the same time, income gains turn out to be more significant than the changes in private investment and public investment that caused them.
The Keynesian multiplier shows how the increase in investment (public and private) affects the increase in output and income. The multiplier is a number showing how many times the initial increase in investment must be increased in order to calculate the resulting increase in national income. In other words, the multiplier is the ratio of the change in the equilibrium level of national income (GDP) to the initial change in spending that caused it.
Let us assume that investments in the economy have increased by 10 billion rubles. If due to this the total (national) income of the country increases by 20 billion rubles, then in such an economy the multiplier is equal to 2.
From this formula it follows that the greater the marginal propensity to consume (the lower the marginal propensity to save), the greater the multiplier. And this means that the greater will be the final increase in national income due to the increase in investment.
Questions for self-control
1. What are the main reasons for the decreasing nature of the aggregate demand curve?
2. Describe the features of the aggregate supply curve.
3. What is the ratchet effect?
4. What explains the model "aggregate demand - aggregate supply"?
5. What is the relationship between the propensity to consume and the propensity to save? How to show graphically this relationship?
6. What is the difference between real and financial investment?
7. Why is the graphical model of the Keynesian theory of macroeconomic equilibrium called the "Keynesian cross"?
8. Describe the multiplier effect.
Similar information.
So, generalizing indicators of the results of the functioning of the national economy are GNP and GDP, which reflect the total value of the product created on the scale of society for final consumption. GDP and GNP can be calculated using the three methods discussed above. The difference lies in the fact that when calculating GDP, only the product produced within the borders of a given country is taken into account, excluding foreign branches and branches of individual firms, while GNP takes into account the product produced by national capital located outside the country.
If we subtract from GDP the sum of values created in the territory of a given country with the help of foreign capital, and add the sum of values produced abroad using resources owned by the citizens of this country, then we get GNP.
Now consider the most important indicators of the SNA, characterizing the movement of GNP (GDP) at its various stages.
It is less than GNP by the amount of depreciation.
NNP measures the annual output of goods and services that a country produces and consumes. It is a more advanced measure of output, but NNP has the disadvantage that it is distorted by the government in the structure of market prices. Without government intervention market prices of all goods without a remainder is decomposed into factor incomes of households. However, the state, by introducing indirect taxes, on the one hand, and providing subsidies to firms, on the other hand, actually contributes to overestimation of market prices in the first case and underestimation in the second.
ND shows what production in a given year has added to the welfare of society. The only component of NNP that does not reflect the current contribution of economic resources are indirect taxes on business. Therefore, the value of the latter, when calculating the ND, is subtracted from the monetary volume of the NNP. NI is understood as the sum of incomes of the owners of factors of production, i.e. the sum of wages, profits, interest and rent.
The national income acts as earned but not received income, tk. not all earned income is actually received by the population and not all income received is earned income.
The nominal value of GNP and GDP calculated on the basis of the SNA serves as the basis for determining all other indicators of the social product, as well as for indicators characterizing the distribution of national income. These include: personal income,disposable income
Personal income (LD) represents income received, which, unlike NI, is earned income. The differences between personal and national incomes are as follows: firstly, part of the income earned (social insurance contributions, corporate income taxes, the amount of their retained earnings) does not go to the population; secondly, a part of the received FA goes to an individual household not in the form of factor income, but in the form of state transfer payments (pensions, scholarships, allowances). The size of transfer receipts is determined by the current regulations and the social status of the family or individual, and not by his participation in the production of a social product.
Disposable income (DI) characterizes that part of personal income that the population can spend at its discretion. To calculate it, the total amount of direct taxes paid by the population from personal income is deducted from the LD. The main types of taxes paid out of personal income are income tax, income tax in the unincorporated sector of the economy, property tax and inheritance tax.
Personal income is the total capital that individual from various sources in the process of life for a certain period of time. Personal income can include not only wages, but also a number of additional income (for example, dividends on securities, transfers, retirement, social payments, rent, etc.). The calculation of personal income is made even before the deduction of personal taxes accrued to the subject. That is, these are all types of income of the population, which include cash receipts from state budget(stipends, pensions), wages at enterprises, income from one's farm, and so on, an indicator that reflects the real well-being of people and their ability to pay (before taxes).
On the contemporary stage personal income have enough complex structure. Them can classify:
1. By changes in the level of consumer prices:
nominal income. This is the amount of capital that is received by a certain person in a specific period of time. This indicator reflects the real level of financial income, regardless of the level of taxes;
disposable income. The money that belongs to this type of profit can be used for solving personal problems and kept as your savings. At the same time, disposable income, as a rule, is lower than nominal. This is explained by the need to deduct from the total amount of mandatory payments and taxes;
real income displays how many people will be able to purchase goods with available funds for a certain period of time
2. According to the form of the unit of measure:
monetary income. It includes scholarships, pensions, business profits, wages at enterprises, unemployment benefits. This also includes dividends on securities, income from real estate, interest on deposits, profit from the sale of agricultural products, income from the sale of foreign currency, insurance payments and others;
natural income. Such profits include products that are made in the conditions of subsidiary farming, payments from social funds, services provided by family members, and so on.
3. According to the degree of intervention of state structures:
primary income are formed under the influence of a powerful mechanism of the market;
secondary income inevitably associated with a change in the policy of the country.
Calculation personal income can produce on next formula:
Personal Income = National Income - Taxes - Retained Income of Companies - Contributions to social insurance+ Transfers
Personal disposable income is used income, i.e. owned by households. It is less than personal income by the amount of individual taxes that the owners of economic resources must pay in the form of direct (primarily income) taxes:
JPL = LD - individual taxes
Disposable personal income (DPI) is the income used, those. available households.
It is less than personal income by the amount of individual taxes that the owners of economic resources must pay in the form of direct taxes, primarily income taxes, as well as personal interest payments on loans, etc.:
RLD = LD - Individual taxes.
Households spend their disposable income on personal consumption (FROM) and personal savings (S):
RLD \u003d Y d \u003d C + S.
SNA indicators quantify total output and total income and do not fully reflect the change in the quality of life. To characterize the level of well-being, we use per capita indicators, such as:
The value of GDP per capita:
the value of national income per capita:
![]()
To enable cross-country comparisons, these figures are calculated in US dollars.
However, these indicators are very imperfect and fail to accurately reflect the quality of life. Their main limitations are that they:
averaged(if one person has two cars, and the other does not have one, then on average everyone has one car);
many do not take into account quality characteristics well-being(two countries with the same per capita national income may have different levels of education, life expectancy, morbidity and mortality rates, crime rates, etc.);
are calculated in a single unit (usually US dollars), but ignore different purchasing power dollar in different countries(for 1 dollar in the USA and, for example, in India, you can buy a different amount of goods);
do not take into account the negative consequences of economic growth(degree of pollution environment, noisiness, gas contamination, etc.).
Net economic wealth
In order to more accurately assess the level of well-being in 1972, two American economists - laureate Nobel Prize James Tobin and William Nordhaus proposed a method for calculating the indicator called net economic wealth.
This indicator, in addition to GDP, includes the valuation of everything that improves well-being, but is not taken into account in GDP, for example: the amount of free time for raising children and self-improvement; labor for oneself; raising the level of education; improving the level and quality of medical care, etc. At the same time, when calculating this indicator, the value of everything that worsens the quality of life and reduces the level of well-being, for example, the level of morbidity and mortality, the level of crime, environmental pollution, the negative consequences of urbanization, etc., is subtracted from the value of GDP.
disposable income
Personal income (LD)
National Income (ND)
2. Minus depreciation charges
4. Minus indirect business taxes
6. Minus contributions to social Security
7. Minus corporate taxes
8. Minus corporate retained earnings
9. Plus transfer payments
11. Minus individual taxes
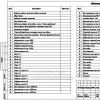
The above diagram clearly shows that GNP can be used to obtain other important indicators national production.
Net national product (NNP) is GNP minus depreciation charges intended to replace the consumed capital during the production of the current year.
national income is the total income earned by resource providers. It is calculated by subtracting from the NIP indirect taxes on business or by summing up wages, rents, interest and profits, ᴛ.ᴇ. as the sum of factor incomes.
Personal income - is all income earned or received individuals. It goes to consumption, savings, paying taxes.
Under disposable income understand income after taxes, ᴛ.ᴇ. everything that remains for consumption and savings. This income also includes transfer payments.
11.3. PRICE LEVEL. NOMINAL AND REAL GNP
Rising prices - the most pressing problem, because it concerns everyone. Prices are constantly changing, and their dynamics must be measured. To answer the question of how much prices have risen or fallen, it is extremely important to determine their level. it average level a broad group of prices as measured by a price index. The price index expresses the relative change in the average price level over a certain period and represents the weighted average of all prices for goods in a certain population. The price index can be determined by the formula:
For example, a price ratio of 1.5/1=1.5 is a numerical index of 150%.
There are several types of price indices: consumer goods price index, industrial (manufacturing) goods price index, GNP price index.
Consumer Price Index (CPI) goods is a measure of the ratio between the aggregate price of a certain set of goods and services, called the market basket for a given time period, and the aggregate price of an identical or similar group of goods and services in the base period. In formula form, it looks like this:


where Р 0 i Р ti- prices i-goods, respectively, in the basic (0) and current (t) period;
Q 0 i - amount i-goods in the base period.
Index of this type does not take into account changes in the weight structure in the current period compared to the base period, which somewhat distorts the result. Such an index does not take into account changes in the structure of consumption in the current period, for example, the replacement of more expensive goods with cheaper ones in the face of rising prices.
The GNP (GDP) deflator is more convenient for measuring the price level, since it includes not only the prices of consumer goods and services, but also the prices of investment goods, as well as goods and services bought and sold on the world market.
The GNP deflator is calculated by type Paasche index - an index where the set of goods of the current period is used as weights:

where Qti- amount i benefits in the current period.
If instead of Q substitute the entire set of goods represented in the GNP, and instead of R, respectively, their prices, we get the GNP deflator.
Unlike the Laspeyres index, the Paasche index somewhat underestimates the rise in the price level in the economy, since it also does not take into account the dynamics of the weight structure, but fixes it already in the current period.
If it is used to estimate the growth in the cost of living, then the impact on consumers of price increases for goods that were present in the base year set but not in the current year set will not be taken into account.
Fisher index partly eliminates the shortcomings of the Laspeyres and Paasche indices by averaging their value:
where P F - Fisher index;
P p - Paasche index;
P L - Laspeyres index.
Price indices are used to assess changes in the rate of inflation, the dynamics of the cost of living.
If GNP is calculated in the prices of the current year, then this is nominal GNP, and if in comparable prices (ᴛ.ᴇ. constant, basic) - then real GNP. Real GNP measures the value of total output in different years, assuming that the price level remains unchanged from the base year onwards throughout the period under consideration. Τᴀᴋᴎᴍ ᴏϬᴩᴀᴈᴏᴍ, real GNP shows the market value of the volume of final output of each year, measured in constant prices, which makes it possible to estimate the change in the physical volume of output over a certain period of time.
Comparing nominal and real GNP, we get the GNP deflator - the general price level
![]()
From the formula, you can express real GNP:
If the value of the price index is less than one, then the nominal GNP is adjusted upward, which is commonly called inflation. If the value of the price index is greater than one, then deflation - downward adjustment of nominal GNP. The process of inflation and deflation is illustrated by an example in the table
TOPIC 13. MACROECONOMIC INSTABILITY:
Disposable income - concept and types. Classification and features of the category "Disposable income" 2017, 2018.
Main macroeconomic indicators are: gross national product (GNP); gross domestic product (GDP), net national product (NNP), national income (NI), personal income (DI), disposable income (DI), general price level, interest rate, ... .
Households' real disposable income is the current period's nominal disposable income adjusted for the consumer price index. Real disposable income reflects the maximum value of goods and services that could ... .
Net National Product (NNP) - overall volume goods and services that a country has produced and consumed in all sectors of its national economy over a certain period of time. NNP = GNP - A If you subtract the amount of indirect taxes from NNP, you can get the value ... - Net national product, national income and personal disposable income.
Nominal and real GNP. GNP deflator and consumer price index. Nominal GNP - reflects the volume of national production in the prices of the current period, that is, at the time of production of this volume of goods and services. Real GNP - total market ... .
Various indicators are used to measure the national product: gross national product (GNP), gross domestic product (GDP), national income (ND), net national product (NNP). GDP - measures the value of the final product produced on ... .